Are We Ready for a New Index of House Value?
New measures move beyond sales-based data
![]() By James R. Follain, Ph.D., and Barbara A. Follain, Cyberhomes Contributors
By James R. Follain, Ph.D., and Barbara A. Follain, Cyberhomes Contributors
Published October 8, 2007
Since its inception in 1896, the Dow has been the most widely watched indicator of the stock market. It originally tracked the movements in the stock prices of 12 large publicly traded and industrial companies. Today it tracks the stocks of 30 large publicly traded companies, but only General Electric is still among the group of stocks tracked. The world has changed since then, and so have the kinds of indexes used to measure the stock market. Now we have the S&P 500, the Russell 2000 and 5000, the DJ Wilshire 5000, and many more. All are designed to track a much wider and more representative set of stocks than the Dow and, in the process, provide more and better information to investors.
A similar kind of revolution may be in the cards for the housing market. The most widely watched indicator of house prices is probably the National Association of Realtors' house price index. The most recent report showed a 2.6 percent decline in house prices for the nation as a whole over the past year. Though a wonderful source of information, the NAR index is based on recent sales transactions. The problem with this approach is that few houses sell each year. As such, the movements in the indexes are often dominated by the particular mix and location of houses that sell in any particular month. What most people want to know is: “What happened to the price of my house?”
You can see the problem with the sales-based indexes by examining the data for the past year. The first figure focuses on recent growth rates in the number existing house sales (Figure 1). One year ago the range of the quarterly growth rates was from about zero (Northeast) to negative 8.4 percent (Maryland). The most recent range for the same areas was from about zero (South) to positive 18 percent (Virginia). The second figure examines the growth rates in median house prices for some overlapping areas (Figure 2). Similarly large variations are apparent; note, especially, the wide swings in the Northeast.
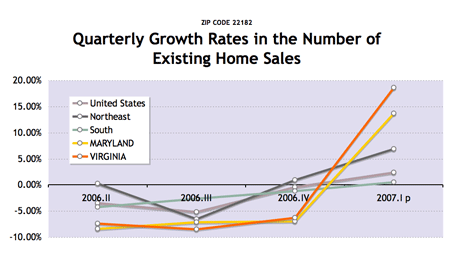
Figure 1
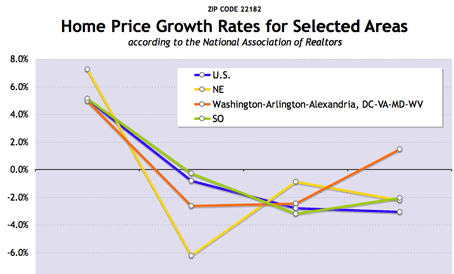
Figure 2
Economists are aware of these limitations and have developed various ways to lessen the problem, including the use of so-called weighted repeat sales indexes. These indexes are based on repeat sales transactions over many years of the same properties. While such indexes offer improvements over an index based solely on recent sales transactions, they are still dependent on sales transactions among a very small portion of the total housing stock.
Is there a better way? We think so. The time may be right for a switch to a more reliable indicator of house prices. Why not estimate the value of every house and every month, not just those that have sold in the past month. Then we can track changes in the entire stock of housing and hone in on particular neighborhoods with confidence that our estimates are not severely skewed by the sale of one particularly expensive or inexpensive house in the neighborhood.
Extraordinary developments in the application of information technology to the housing market make something like this feasible in many parts of the country. Indeed, these developments are the basis on the website you are viewing. The approach applies sophisticated processes to assign a value to each in the database, whether it has sold recently or not. These are called automated valuation methods, or AVMs. Some of these methods involve the application of equations estimated by statistical processes while some others emulate the “sales comp” process long used by appraisers. In either case, if a property has an address, it is most likely that a value can be placed on the property.
To see the differences in valuations with the old model and the automated valuation method, consider the 22182 ZIP code in Northern Virginia. You can learn a lot about this ZIP by typing in 22182 into the search bar of Cyberhomes. Among other facts, you will learn that this zip is in Vienna, Va., and has a population of 23, 946 and 7,880 homes that average about $850,000 each. One particularly interesting piece of information highlights our concern about indexes based on sales prices. When you click on the Neighborhood Details tab, you can see that the average sales price in this ZIP went from about $770,000 to $925,000 within the past year. Clearly, the mix of houses that sold changed dramatically and distorts any real sense of what is happening to the values of most homes.
Our approach uses the estimates of value for each and every single-family detached house with four bedrooms and two full baths in 22812. This produces a population of 1,841 properties to develop an index of house values. They averaged $795,000 in January, or about $352 per square foot of living space. In total, these houses were valued at $1.49 billion in January of this year.
By May, they were valued at $1.48 billion. This is a decline of 0.6 percent over five months and -1.4 percent on an annualized basis. Properties in the middle of the pack experienced a similar decline as the entire stock; hence, the performance of the entire stock is representative of what is happening in the middle of the distribution, at least for this period, type of property, etc.
These values can and are computed each month (Figure 3). There is some volatility in the monthly totals and movements, but nothing like what is observed in a series based solely on sales transactions. To highlight this point, we compare the growth rates based on the AVM estimates versus those based on sales in 2007 (Figure 4). The series based on sales prices is clearly more volatile than the AVM series and stems from the fact that the number of sales in January through May was typically five or six and the mix of properties sold changed from month to month.
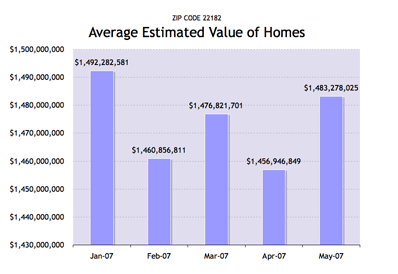
Figure 3
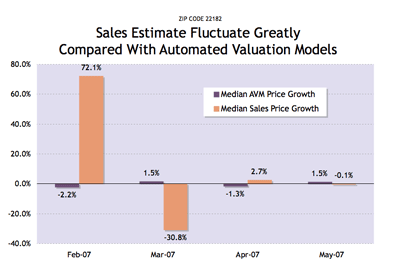
Figure 4
Another benefit of the application of an AVM based valuation to the entire housing stock is the ability to track specific neighborhood valuations. For example, one might focus on ZIP+4 areas. Without mentioning specific locations, we do find several with growth rates well below the average and a few with growth rates well above the average. You can check your favorite ZIP+4 area by typing it into the Search window and looking at changes over the past two months for yourself. Similarly, we examined properties by three size categories: large (more than 2,500 square feet); small (less than 1,500); and the medium (1,500-2,500). We find no substantial size effect in this area of the country over the past five months. These kinds of attempts to identify “who’s hot, and who’s not” are virtually impossible for a sales based approach since the sample sizes would typically be zero or one.
Now let’s focus on what is the most critical question: Do the recent trends suggest clues about the future of house prices in this part of the world? We think they do. The most common outcome in housing markets following a boom is a period of relatively flat house price growth. This seems to be what we are finding in 22182. That is, after five or more years of house price growth in which most houses doubled in value, flatness — rather than a headlong decline in house prices — has emerged. If so, then perhaps house prices in 22182 have reached the bottom of this house price cycle. This would be our bet. In any event, the application of AVMs model to every house in each and every month will likely provide great insight about this particular housing cycle.
News & Insights
-
Green Light for GSA’s OASIS SB Vehicle
-
GAO Ruling Validates FI Consulting’s Financial Analysis