AVMs Have Feelings, too
An automated valuation method is only as accurate as the models used to generate house values
![]() By James R. Follain, Ph.D., and Barbara A. Follain, Cyberhomes Contributors
By James R. Follain, Ph.D., and Barbara A. Follain, Cyberhomes Contributors
Published: September 04, 2007
Wouldn’t it be nice to know that all the experts agree on the best way to measure recent trends in house prices for the nation and, in an ideal world, your own neighborhood? Alas, we do not live in an ideal world. The standard measures of movements in house prices are based on recent sales transactions. The main problem with this approach is its reliance on transactions that involve a relatively small part of the total housing stock. An alternative has emerged due to extraordinary developments in information technology — automated valuation method estimates of house value.
Like anything else, AVMs have some weaknesses and limitations, but we’ll only go so far in our critique because “AVMs have feelings, too.”
In particular, the accuracy of an AVM is dependent on the models used to generate house values. The best AVMs have confidence scores in excess of 90 percent, which is often interpreted as meaning that the AVM estimate is within plus or minus 10 percent of the “true” market value of the property with a high degree of confidence. A low confidence score would be at or below 70 percent. AVM confidence scores are often studied as much as the AVM estimates themselves and much has been learned about them. (A confidence interval is a random variable dependent upon the particular sample used for estimation purposes and the criteria used by the analyst. Doug Gordon of Freddie Mac offers a very nice discussion of the topic.)
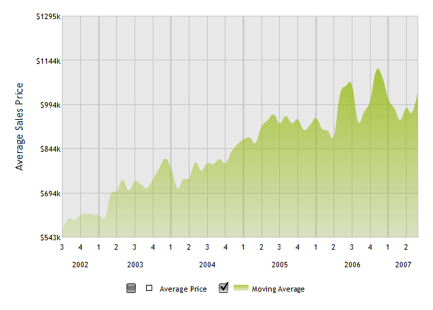
To help make these points more clear, we’ve presented AVM results for a particular housing market — the 20816 ZIP code in Bethesda, Md. Typing 20816 into the search box on Cyberhomes reveals an area with 6,622 homes with an average AVM estimated value of $867,365. Further clicking on Neighborhood Details leads to http://www.cyberhomes.com/neighborhooddetails.aspx?zip=20816, a display of other valuable information about this housing market. For example, the volatility of monthly average sales prices is highly evident; see the chart below.
Our analysis of a subset of the total housing stock in 20816 sheds light on house price movements in this area and the accuracy of AVMs for single-family detached residences with 2 bathrooms. Most of these have living area under 3,000 square feet; the average living area is just over 1,700 square feet. The sample includes 844 of the 6,622 houses in this market, or about 15 percent. The highest-valued property by the AVM is over $1.5 million and the lowest-valued property is $556,000; the average is about $900,000.
A look at trends in house prices in this area over the past 15 years or so brings to life the meaning of a house price boom (Figure 1). Most notably, the average rates of growth in the price per square foot exceeded 10 percent per year from 1999 through 2005. The average sales price showed a similar but more volatile pattern; the average sales price rose 21 percent in 2001.
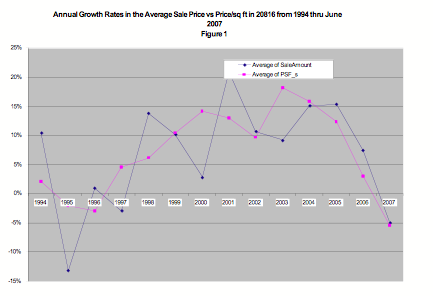
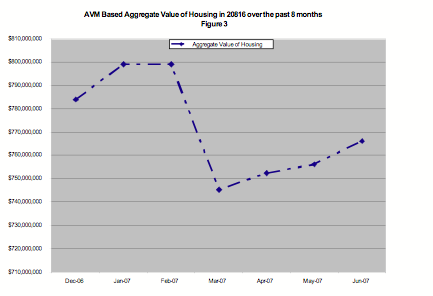
Clearly, the party is over. According to these sales-based indexes, prices dropped precipitously in the past 12-18 months. The average price per square foot and the average sales price in the first six months of 2007 are each down 8 percent from their 2006 averages. Focusing on monthly patterns over the past 18 months (Figure 2) shows a more volatile pattern and an abrupt ending. The monthly growth rates declined by 15 percent in both September and October and remained at or below zero until April 2007.
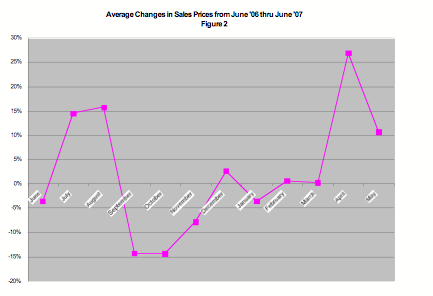
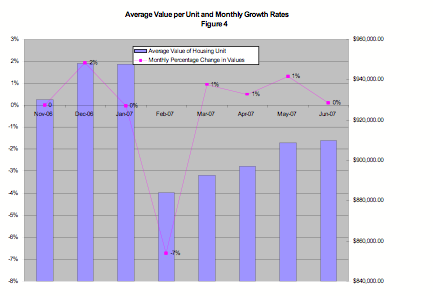
Now consider what AVMs have to say. The AVMs have been applied to each of the properties in this study each month since November 2006. The aggregate value of the 843 properties in the group is tracked in Figure 3. The average price of these properties and the rates of growth or decline in the average prices are depicted in Figure 4. The cumulative decline between November 2006 and June 2007 was only 2 percent. However, both series reveal a major decline in values in February 2007. The aggregate value of this stock declined during that month according to the AVM estimates by over $50 million. The average values of these houses declined by almost 7 percent from $948,000 to $884,000. Other than this sharp drop in February, changes in the AVM estimates of value are at or just above zero and quite stable.
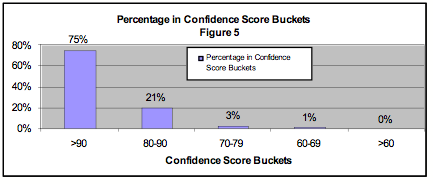
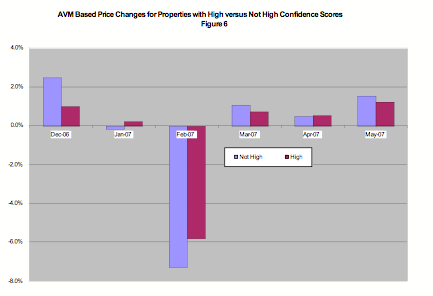
What happened in February to generate such a decline? Why does it show up in the AVM estimates and not in the series based on average sales prices? One possibility is that the series is influenced by the inclusion of AVM estimates with low confidence scores. Our examination suggests this is not the case. In fact, 75 percent of the sample has a confidence score in excess of 90, which is quite high, and only 4 percent are below 79 (Figure 5). Evaluating the price changes among those with high confidence scores versus all others does not generate much of a distinction (Figure 6). Both again show the sharp decline in February and relatively stable and slightly positive growth otherwise.
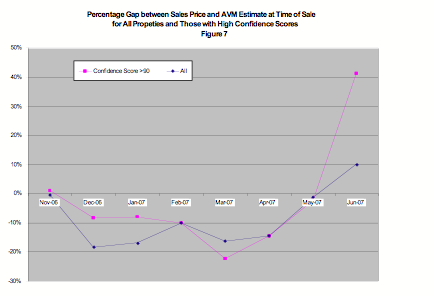
We decided to drill down and examine the actual sales prices relative to the AVM estimates of value for properties that sold during the period in which AVM value estimates are available (November through June). Two interesting patterns emerge. First, the actual sales prices were consistently lower than the AVM estimates of those properties in the months in which the properties were sold. Second, the average gap was negative 8 percent in December among properties with confidence scores in excess of 90. The extent of the overvaluation by AVMs increased for the next several months. The largest gap was in March, when sales prices were lower by 22 percent than the AVM estimates of those properties with high confidence scores. The last two months show that AVMs now appear to be lagging the growth in sales prices. The results are summarized in Figure 7 for the properties with high confidence scores and the entire group.
Guess what? AVMs, like any estimation process of complex market phenomena, have weaknesses, too. One possible and specific interpretation is that the AVM estimates in this market appear to react with a lag to the sharp house price declines in the latter half of 2006. This might be due to a lag in the reporting of such data or to a more general pattern that likely affects any valuation approach — they tend to overstate value on the way down and understate value on the way up. Stay tuned to see what finally happens, but AVM-based estimates of value will continue to be part of the arsenal of information and tools used to gauge what’s happening to house prices in the nation and in our neighborhood.
News & Insights
-
Green Light for GSA’s OASIS SB Vehicle
-
GAO Ruling Validates FI Consulting’s Financial Analysis