Property tax reform: a tough act that just got tougher
Decline in house prices makes task more important ... and more difficult
![]() By James R. Follain, Ph.D., and Barbara A. Follain, Cyberhomes Contributors
By James R. Follain, Ph.D., and Barbara A. Follain, Cyberhomes Contributors
Published: January 28, 2009
Property tax reform has been hotly debated in recent years in many places, especially the Northeast. In most cases the conflict is between two ideals: preserving a local source of income for locally provided public services — mostly K-12 public education — and avoiding what many people might consider excessive and inequitable tax levies. Balancing these ideals and bringing about widely accepted property tax reform seems to be a very difficult undertaking, judging by the ongoing and often heated debate in New York and other Northeastern states. We believe that the substantial decline in housing prices in many parts of the country, including parts of the Northeast, has made the case for property tax reform both more compelling and more difficult to achieve.
One state’s reform proposal
A report released in December 2008 by the New York State Commission on Property Tax Relief provides an excellent overview of the issues facing New York and many other states. In the case of New York, property tax levies and property tax rates as a percent of property values are among the highest in the nation. For example, New York is home to the county with the highest median property tax bill — $8,400 per year in 2007 — and the county with the highest property tax rate as a percent of property values — 2.9 percent in Niagara County. Our January 2009 article,“Are Property Taxes a Silver Lining Amid the Slide in House Values?” provides additional examples of the high property tax burden faced in many parts of the Northeast.
The primary causes of New York’s high property taxes identified in the report are:
- More than 50 percent of the cost of public K-12 education is financed by local property taxes, which is a larger portion than in most states.
- The cost of this education per pupil is higher in New York than in any other state; only the District of Columbia has a higher per-pupil cost.
- The cost of education has risen much faster than the general level of prices as measured by the consumer price index.
As a consequence, the property tax burden has continued to rise relative to the major metrics: property values and the consumer price index.
The commission offered recommendations to reform the property tax based upon a wide-ranging review of data, excellent research and a series of hearings held all over the state for the past year or so. Some have to do with limiting the growth in public education expenditures, but we will focus on three that are relevant to the housing market.
- Cap on property tax growth: A cap, or ceiling, on the annual growth in local property taxes would mimic Proposition 2 1/2 in nearby Massachusetts. In New York, a county’s maximum property tax increase would be 4 percent per year, or 120 percent of the growth in the consumer price index, whichever is less. Massachusetts limits annual growth to 2.5 percent per year.
- Increased and better targeted property tax relief: An existing system of relief payments made to selected homeowners — often called “circuit breakers” — would be enhanced and better targeted. Low-income owners and the elderly would be likely beneficiaries of the changes.
- Uniform statewide assessing standards: New York is one of only three states that do not have clear statewide valuation standards and is one of the few without periodic revaluation of all properties. Neither does it require that property assessments be based upon full market value; an assessment at some fraction of full market value is typical. The commission recommends adoption of a statewide full value standard, which would require that every parcel be valued at its estimated market value: 100 percent of full value.
The report and the full set of recommendations were submitted on Dec. 1 to Gov. David Paterson, who expressed hope that “the Commission’s recommendations will guide us toward legislation that will help school districts maintain current programs and provide a high standard of education for all students.”
Unanticipated challenges to the recommendations
Although it seems that the commission members did their homework on most issues, like most people they did not fully anticipate the housing debacle being experienced in many parts of the country. As a result, we believe that their recommendations fall well short of what may be needed to generate the kind of immediate, substantial and meaningful property tax reform that many New York residents were hoping to see.
The commission seems to have focused its attention on the typical experience for house price appreciation of the past 20 years. During this time, houses tended to appreciate at or above the rate of underlying inflation, at levels more or less the same among different tiers of the housing market. The experience of the past two years, and the prospects for the next year or so, are quite different. We highlight three critical differences between the dominant history leading up to the house price bubble bursting and the near-term environment, in which the recommendations are to be introduced. We believe the change in conditions will greatly dampen the benefits of their recommendations.
1. House prices have declined substantially in many parts of New York; there are good reasons to believe the slide will continue through 2009 or 2010. Consider the New York City metropolitan area. According to the S&P Case-Shiller Price Indexes in what is called the NY Commuter area, house prices have declined by more than 12.2 percent from their peak values in the middle of 2006. Furthermore, there are reasons to believe the decline is far from over. For example, the Chicago Mercantile Exchange Futures Market for house prices suggests an additional 10 percent decline is possible for the New York metro area.
These experiences are in sharp contrast to what happened between 2000 and 2006. For example, house prices increased in Boston by more than 80 percent between January 2000 and their peak in early 2006. Likewise, New York house prices increased by 116 percent between January 2000 and mid-2006. Clearly, the proposed cap is more effective in an inflationary environment than the one we are in the midst of now. Limiting the annual growth in property taxes to 4 percent provides no cap on the growth in the real economic burden of the tax for those experiencing property value declines. One could even argue that keeping property taxes flat in a world in which house price declines are double-digits falls well short of reducing the real burden of the property tax over the next couple of years.
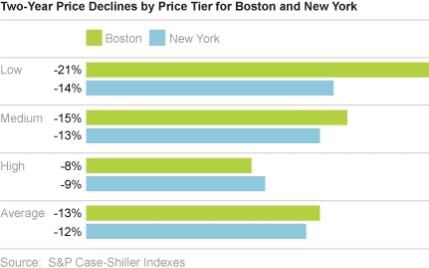
2. The pattern of the price declines is quite uneven. In particular, those in the lowest price tiers appear to be experiencing the largest price declines since 2006. Again, consider the S&P Case-Shiller indexes. Prices declined by more than 20 percent since their peak in the lowest price tier (under $285,000) in Boston, compared to an average decline of 8 percent in the highest tier (above $420,000). A similar pattern is found for the New York metro area, though not quite as stark. Prices declined by 14.2 percent in the lowest price tier ($327,000) compared to a decline of 9.2 percent in the highest price tier (above $485,000).
This pattern of larger price declines among the lowest tier of house prices is quite different than what took place in many parts of the country between 2000 and 2006. In most places, house prices appreciated more rapidly in the lowest tiers than in the higher tiers. We highlighted this point in a February 2007 article, “ZIPpity Do Da!,” which showed that the famous Beverly Hills ZIP code — 90210 — experienced the least property price appreciation between 2000 and 2006 among all ZIPs in Los Angeles County. Indeed, the same basic story appears to have played out in Boston and New York. House prices appreciated at dramatically higher rates among the low-tier segment in Boston (118 percent vs. 66 percent for the top tier) and New York (160 percent versus 94 percent) between January 2000 and their respective peaks in 2006. The relevance of these trends pertains to the proposal regarding circuit breakers. Imposing a cap and introducing a circuit-break system that ignores such differential price patterns will not pass on the same amount of relief as the commission may have envisioned.
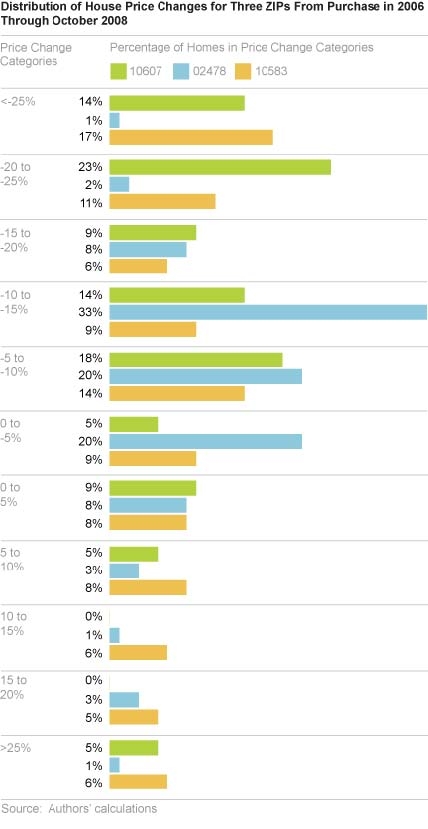
3. Estimated changes in the values of properties within a given area can vary substantially from what is suggested by an index such as the S&P Case-Shiller or any other major index. To make the point and offer some concrete evidence in support of it, we focused upon price patterns in three ZIP codes. Two ZIPs, 10583 in Scarsdale, N.Y., and 10607 in White Plains, N.Y., are in Westchester County, which had the highest average property taxes in the country in 2007. We also chose a ZIP from Massachusetts’ Middlesex County, 02478 in Belmont. Average property taxes in Middlesex were $4,235 per home in 2007 and among the highest in Massachusetts. Most homes in all three ZIP codes are relatively high priced.
We looked at homes purchased in 2006 to shed light on the movement of property values in these ZIP codes.
Current estimates of their values were generated as of October 2008 using the valuation techniques embodied in Cyberhomes. Average prices for our sample of properties declined in each ZIP. Prices declined by an average of 5 percent since 2006 in 10583, 11 percent in 10607 and 15 percent in 02478. One quick conclusion is consistent with a previous point: These folks would not see much relief from a simple cap on the growth in property taxes tied to the existing levies or the consumer price index since their values went down, on average.
What is most striking, perhaps, is the wide variation in price changes among these properties. For example, about 20 percent of properties in ZIP 02478 experienced price declines between 0 and -5 percent since 2006, but the bulk of the properties experienced even larger declines. Despite this relatively gloomy picture, about 15 percent experienced some modest price appreciation. About 25 percent of those in 10607 experienced increases in their values, but 75 percent experienced declines and the distribution of the declines is skewed to the left (more declines). Some 37 percent of the properties in White Plains experienced declines in excess of 20 percent since 2006. The ZIP code with the most pronounced dispersion in property value appreciation is 10583 in Scarsdale, but even here there is a pronounced rise in the distribution of those with substantial price declines. About half of these properties experienced a price change of between plus or minus 10 percent; however, more than 27 percent experienced price declines of more than 20 percent. In sum, don’t think that your house has changed by the same amount as some aggregate index of the larger metropolitan area in which you live. Odds are you did a little better or worse.
This variability in price changes among properties in the same general location is not unique to these ZIPs. We have highlighted the variability around indexes in previous articles such as “What Can You Learn From Home Price Indexes?” Much of this is inherent in the nature of the business of estimating the value of a highly heterogeneous commodity: someone’s home. Though some methods and models are clearly better than others, imperfections and hence variability around an index are expected.
The harder questions are whether the variability of house prices around an index and, more generally, the difficulty of valuing a residential home are greater during the current turmoil than in more normal times. A definitive answer requires much more data and study, but based upon discussions with other experts such as Mike Sklarz, senior economist for Cyberhomes and a longtime expert in automated valuation models, we suspect that the variability is higher now and will probably remain so until the glut of foreclosure sales is over and we return to a more normal market. If so, the assessment process undertaken by local governments will be more difficult and costly, to ensure that assessments are fair and accurate.
What should reformers do?
A few suggestions for reform arise from our analyses that are not among those suggested by the commission. First and foremost, meaningful limits or caps on the property tax should place more focus on changes in the value of residential real estate. Caps defined in terms of the consumer price index or some positive growth rate in the amount of property taxes won’t do the trick of providing relief in today’s economy marked by unprecedented declines in property values. For example, reformers could limit the growth in property taxes to be no higher than the growth in property values. During times of declining property values, property taxes would need to decline.
Second, an improved circuit breaker system should consider a broader measure of ability to pay that would include uneven changes in the value of real estate among broad tiers of the community. For example, circuit breakers inherent in the income tax system should be lessened for those in the lower tiers when their house values are rising relative to the higher tiers and vice versa in order to maintain the sense of fairness that the commission is seeking. Of course, this may actually come about naturally if assessments are done accurately and updated often; otherwise, a system of circuit breakers geared to income tax adjustments may be counterproductive at times.
Third, and probably the hardest to implement of our recommendations, more resources and a wider array of methods are likely needed to generate a set of valuation estimates that will be regarded as fair and accurate during these turbulent times. The difficulty arises because of the reduced number of comparable sales and the unprecedented size of the declines. Though difficult to do, we suspect that the wide availability of automated valuation estimates on the Internet will lead to substantial complaints and homeowners who feel their valuations are unfair or inaccurate. In fact, the wide dispersion of estimates may even lead to a highly skewed set of protests from those whose valuations came in on the high side of the average for their communities.
Though our main point is that the turmoil in the housing market probably makes property tax reform more difficult,there is some potentially good news — information technology may be able to help. We often hear about how information technology can reduce health care and education costs. The same is true, we think, regarding property tax and, in particular, the quality of data and methods used to assess property values. We think this is the possible silver lining waiting to be found and hope that President Obama’s team will see this as an example of a “shovel ready” project to help state and local governments keep their property tax systems effective and fair.
News & Insights
-
Green Light for GSA’s OASIS SB Vehicle
-
GAO Ruling Validates FI Consulting’s Financial Analysis