ZIPpity do da!
Examining LA house appreciation at ZIP level reveals the biggest winners
![]() By James R. Follain, Ph.D., and Barbara A. Follain, Cyberhomes Contributors
By James R. Follain, Ph.D., and Barbara A. Follain, Cyberhomes Contributors
Published: February 5, 2007
We admit to being hooked on television shows that feature detailed looks at criminal investigations. You know the ones: the Law and Order family, the CSI family, Monk, Closer, etc. We love the emphasis upon forensics to uncover what really happened. The characters on these shows can do amazing stuff, benefiting greatly from advances in information technology.
Our article “What Can You Learn from Home Price Indexes?” set the stage for this particular episode of our investigation of property values in Los Angeles County. In that article, we examined the ability of a metro area house price index to predict the actual sales prices of a large sample of properties purchased and sold since 2000. The indexed approach worked pretty well for about two-thirds of the sample; but for the other third, the indexed approach was either too high or too low by more than 20 percent. In other words, a large number of properties either appreciated much more than the index or much less.
In this article, we want to drill down to the ZIP code level, consistent with the general truism that all real estate markets are local. We want to identify those ZIP codes in which house prices rise much faster or much slower than predicted by the indexed approach. Also, we investigate several characteristics of the relative winners and losers that strike us as interesting.
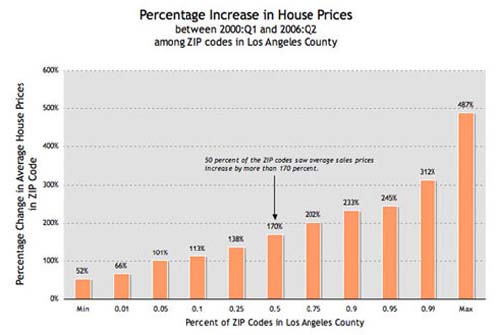
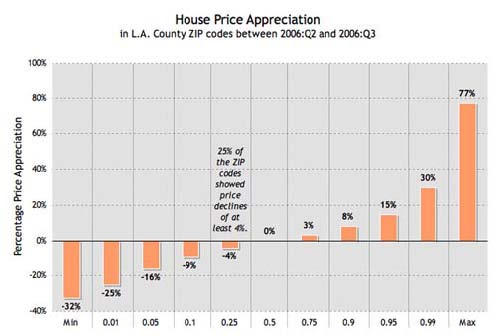
We begin with a summary of how Los Angeles ZIP codes have fared since 2000 in terms of the average house price appreciation of sold single-family properties. A summary of the results is presented in Chart 1. It shows the distribution of the percentage increases among the ZIP codes. For example,50 percent of ZIP codes (the median) realized appreciation rates in excess of 170 percent, and 50 percent experienced appreciation rates less than 170 percent. This is consistent with the story told by the three major indexes over this period. The major conclusion from Chart 1 is consistent with the findings in our previous article: there is substantial variation around the typical appreciation rate. Ten percent of the ZIP codes experienced appreciation rates of 233 percent. In other words, 10 percent of the properties were more than 3.3 times higher in the second quarter of 2006 (2006:Q2) than they were in the first quarter of 2000 (2000:Q1). At the other extreme, 10 percent of the ZIP codes experienced appreciation rates of a mere 113 percent.
One relatively straightforward way to characterize the winners and losers(or, shall we say, lesser winners) is to simply list their ZIP codes. Table 1 contains the 10 ZIP codes with the smallest rates of appreciation and the 10 with the largest appreciation rates since 2000.
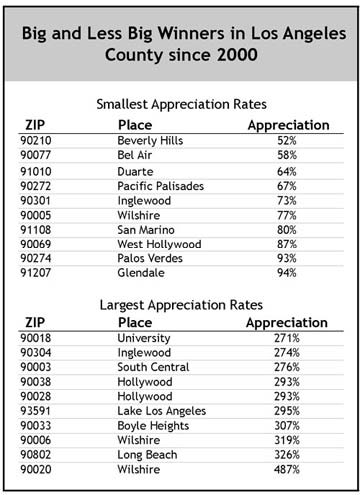
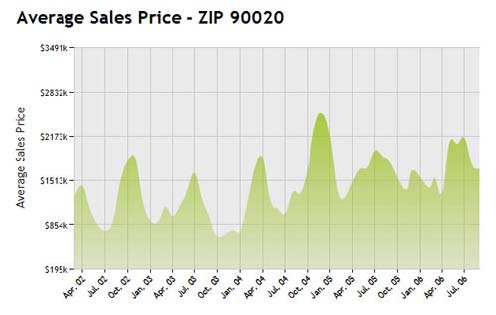
The ZIP code with the largest appreciation rate since 2000 is 90020, which showed a remarkable increase of 487 percent! By searching ZIP 90020, you can find properties in the vicinity of Wilshire Boulevard and Western Avenue. At this stage, pick one property and open up the “Charts and Graphs” option, and then the ZIP Analysis tab. You’ll find a wealth of information about this particular part of Los Angeles County, such as the average sale price versus square footage, average sales counts by price range and other housing characteristics. For example, you’ll see that average prices in this ZIP code in the most recent quarter are over $1.5 million (Chart 2). You will also notice a rather volatile price series, which suggests that one reason for the large increase since 2000 is the sale of relatively high-priced properties in 2006:Q2.
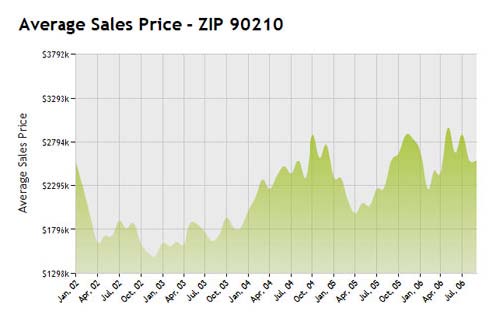
At the other end of the scale is ZIP 90210, which covers Beverly Hills. Don’t feel too sorry for these folks (Chart 3). The average price of a property in this area is in excess of $2.7 million, and they still saw appreciation in excess of 50 percent since 2000. Again, the path from its value in 2000 to today’s average sales price is not a straight line; substantial volatility exists because of the wide variety of homes being bought and sold each quarter.
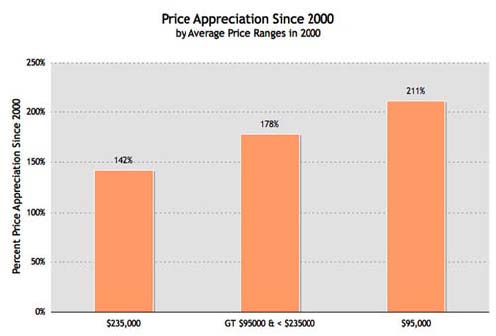
We also searched for other ZIP code characteristics that might vary systematically with appreciation since 2000. A wealth of such ZIP code information about LA County is available on the Los Angeles United Way’s website. We explored whether variations among ZIP codes in total population, population density, distances from certain location, median household income, and some other characteristics showed much correlation with house price appreciation from 2000. The pattern that struck us as most prevalent is the larger appreciation rates among ZIP codes with relatively low house prices in 2000 than among those with relatively high house prices in 2000. The rate of house price appreciation was much higher among those with relatively low house prices in 2000 and much lower among those with relatively high prices in 2000. Chart 4 demonstrates the clear pattern that emerges when we divide the data into three groups: those ZIP codes with 2000 property values less that $95,000 (lowest 10 percent of the distribution); those with 2000 property values above $380,000 (top 10 percent); and those in the middle. The ZIP codes with the lowest initial values increased by 211 percent, on average, versus only 142 percent for those with the highest initial values. The case of 90802, in Long Beach, is an obvious example of this. Average sales prices there increased from $86,000 to over $380,000 since 2000.
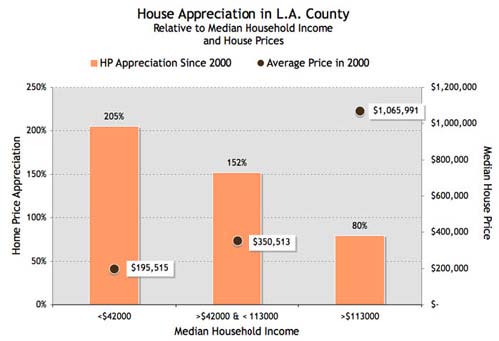
We also found that, on average, house price appreciation was higher in ZIP codes with relatively low median household incomes in 2000, and vice
versa (Chart 5). For those ZIP codes in which median household income in 2000 was below $42,000 (lowest 10 percent of ZIP code incomes), house price appreciation averaged 205 percent. For those on the other end with median household income in 2000 in excess of $113,000 (top 10 percent of ZIP code incomes) house price appreciation was only 80 percent.
One possible explanation for these findings is the boom in subprime lending since 2000. The plethora of affordable housing loan products allowed more people in the lower portions of the income distribution to qualify and own homes than ever before. One possible consequence is a relatively strong growth in the demand for housing by these households and, consequently, relatively strong house price appreciation in these properties. The story to this point is a feel-good story. While there surely were variations among places, almost everyone enjoyed substantial house price appreciation if we look back to 2000. The more recent history is not so uplifting (Chart 6). The median appreciation rate over this period is, essentially, zero; half of the ZIP codes showed increases in average sales prices, and half showed decreases. Twenty-five percent experienced declines of at least 4 percent in values. The critical issue, in our view, is whether the places with the largest price declines are those which benefited the most from the boom in subprime lending. So far, our statistical analysis and our perusal of the patterns do not suggest this is the case.
What does the future hold in terms of house price appreciation for Los Angeles and for other places? This is the question we’ll tackle in our next two articles. We’ll rely upon a new source of information — the Chicago Mercantile Exchanges new futures market in house prices. We’ll also suggest how one can gauge the overall market’s perception of house price appreciation by examining rent-to-value ratios. In the meantime, if you have any comments on these first two articles, or suggestions for futuretopics, please let us know. By the way, we won’t always focus on Los Angeles County, which may interest those other 95 percent of the population who, like us, live somewhere else.
This article was written for www.cyberhomes.com
News & Insights
-
Green Light for GSA’s OASIS SB Vehicle
-
GAO Ruling Validates FI Consulting’s Financial Analysis