Are We There Yet?
The market bottom still lies ahead, based on rent-to-value ratios in the Miami condo market
![]() By James R. Follain, Ph.D., and Barbara A. Follain, Cyberhomes Contributors
By James R. Follain, Ph.D., and Barbara A. Follain, Cyberhomes Contributors
Published: April 30, 2007
Where are housing prices headed? Homeowners, home hunters and investors all want to know whether house prices have arrived at their low point for the current cycle. The evidence is mixed, at least based on one analysis of a key indicator of housing price trends: the ratio of rent to home value, using Miami’s condo market as a case study.
The rent-to-value ratio can be a useful barometer of the steam left in the housing market. Let’s look at an example of how it works. In 1974, a young couple bought a home for $22,000. At that time, the rent they had been paying was about equal to the mortgage payment, $222 per month. It seemed like a good deal, and it was: They sold the house three years later for $30,000. They had grown their investment by $8,000.
Later, this couple used their profits to buy a more expensive home. In this case, monthly rent would have been much less than the mortgage payment on this home. It seemed like not such a wise investment. The house sold three years later for the same price that they had paid for it.
The rent-to-value ratio can provide insight about the future path of house prices because investors are choosing to put their money into real estate rather than other investments. Consider the investor in real estate, who has been quite active in the Florida condo market. Her return consists of rent and capital gains. If, on average, the expected returns to the real estate investment equal those for an alternative investment of similar risk, then a rent-to-value ratio lower than the expected return on the alternative investment means that the real estate investor is expecting to make up the difference when the property is sold. Hence, all else equal, a lower rent-to-value ratio implies higher future appreciation in the real estate.
Investors in stocks will note a strong similarity between this story and one often told about the predictive power of price-to-earnings ratios in the stock market, or P/E ratios. E is equivalent to rent in housing and the P/E ratio is just the opposite of the cap rate in housing parlance.
A number of studies have been conducted of the rent-to-value ratio. We highlight three recent and very good ones.
- In 2003, well-known economist Edward Leamer of UCLA wrote a paper called “Bubble-Trouble? Your Home Has a P/E Ratio, Too,”1 stressing the similarity between the dot.com bust and housing markets in California. He wrote: “The bottom line is that the San Francisco has an elevated P/E ratio but a weak E market now, and [will] for some time to come. That’s a bubble.” Of course, history did not conform to Professor Leamer’s quite reasonable theory. House prices in the San Francisco Bay area increased by 45 percent 2003.
- A study by an excellent team of housing economists — Chang, Cutts and Green — involved a careful analysis of trends in rents and house prices for the 1980s thru 2002 in many metropolitan markets.2 They used the same logic and solid empirical evidence to support the rent-to-value ratio as a predictor of future house prices. In essence, house price growth in 2002-2004 was highest in those MSAs in which the rent-to-value ratios were lower at the beginning of this period.
- A paper by economists at the Federal Reserve Board offers a more complex and sobering view about the potential predictive power of the rent-to-value ratio.3 In particular, they show that the relationship between rents and values varies widely among markets, time periods and the interest rate environment. In particular, there appears to have been a noticeable and difficult to explain decline in rent-to-value ratios in most of the country after 1997.4 For example, the U.S. rent-to-value ratio dropped from about 5.6 percent in 1978 to 3.7 percent in 2005.
As economists ourselves, we decided to do some of our own investigation, focusing upon rent-to-value ratios in five ZIP codes in Miami.
- Why condos? First, we think our experiment is something you can do for your own local market. The key is to find rents and values for the same property. We think this is most easily done for condos.5 Although there is wide variation in the size, quality, amenities and location of the condos, we further simplified the analysis by focusing upon two-bedroom, two-bath condos with less than 2,000 square feet of living area and built since 1980. Lastly, and as suggested by a recent CNN article, condos may be the first to reflect the changing sentiments of investors (versus owner-occupants) about the housing market.6
- Why Miami? This is among the hottest condo markets in the country.7 As such, it is a market in which the notion that the “worst declines are still ahead” may have merit. We also have access to an index of rents constructed by the Bureau of Labor Statistics for the Miami MSA.
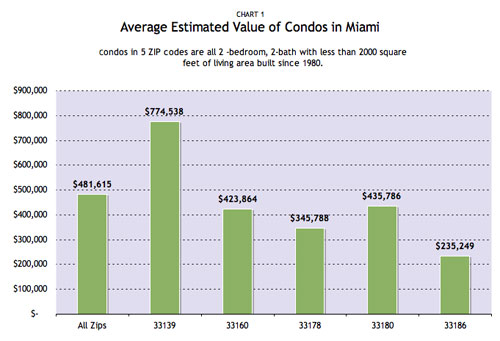
- Which ZIP codes? We picked five ZIP codes with substantial numbers of condos in order to hold as many factors constant in our analysis as possible. The average current values of our condo type for each of these ZIP codes and for all five ZIP codes are contained in Chart 1. The average value is about $480,000 for all ZIPs. The highest average value is $775,000 (33139) and the lowest is $235,000 (33186), so our ZIP codes include a wide variety of locations.
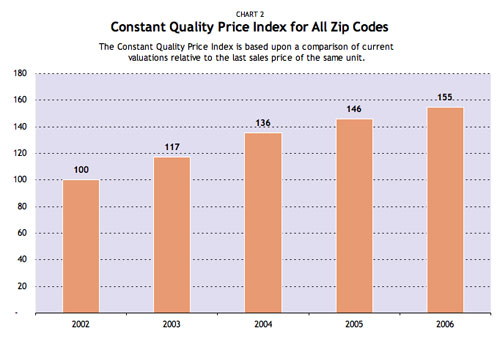
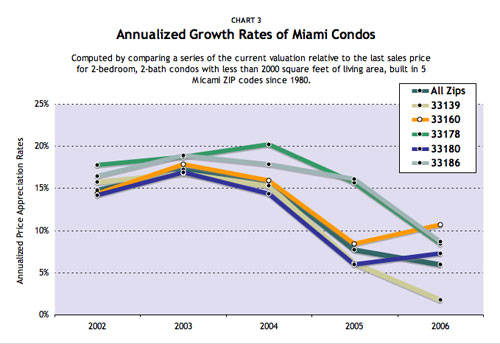
We begin by reviewing recent history in the market values of our condo type. The index of the market value from 2002 through 2006 (Chart 2)8 shows a substantial jump in the index value since 2002, especially in 2003 and 2004. Nonetheless, evidence of appreciation in the values of these units continued through 2006. As seen in Chart 3, the same basic pattern is evident among all five ZIP codes.
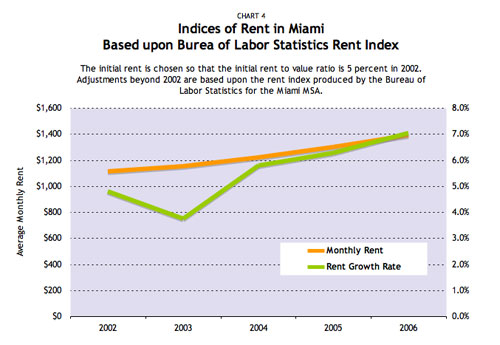
Now we move to an analysis of rents in the Miami area. The average monthly rents and the growth rates in these rents since 2002, according to the Bureau of Labor Statistics, are contained in Chart 4. Rents have clearly grown during the entire period. The average annual growth rate is about 4.5 percent; growth was a little slower in the earlier years and a little higher in the last two years.9
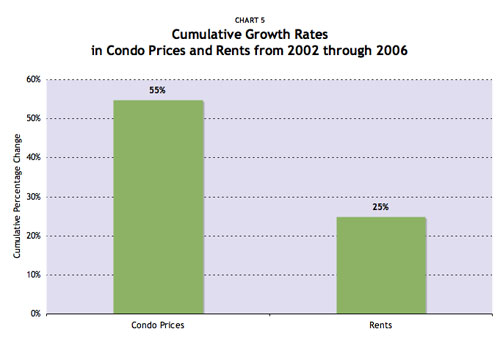
Combining the information about the growth in rents and condo prices shows a clear pattern: Condo prices in Miami increased substantially more than rents during the period 2002-2006. Prices increased by about 55 percent while rents increased by less than half this amount (Chart 4). As a result, the average rent-to-value ratio among this class of properties has declined substantially since 2002. It now stands at 3.7 percent and has been near that level for the last two years (Chart 5).
From this analysis we can offer three alternative scenarios for the housing market:
- Scenario 1: The good times keep on rolling. Let us assume the alternative rate of return to investors housing is 8 percent and the expense of operating the properties is one percent. Then, investors in Miami are expecting future annual appreciation rates in excess of 5 percent.10 Assuming the general rate of inflation stays in the vicinity of 3 percent, the market (and our assumptions) believes that condo prices will continue to rise in real terms, 2.3 percent to be precise.
- Frankly, we are surprised by this outcome. Our impression entering this analysis was that the rent-to-value ratios would demonstrate a sharp correction in the market’s perception of future price growth.
- Frankly, we are surprised by this outcome. Our impression entering this analysis was that the rent-to-value ratios would demonstrate a sharp correction in the market’s perception of future price growth.
- Scenario 2: We’re there and the worst is over: Perhaps the 8 percent assumption is too high. It is quite possible that the expected rate of return on an alternative investment is lower today than five years ago for a couple of reasons. First, expected inflation is probably lower by 1 percent or more.11 Second, risk premiums on investments of all types may be lower. Where did this come from? None other than former chairman of the Federal Reserve Board, Alan Greenspan. Indeed, he was widely quoted during the last week of February as suggesting that current risk premiums are too low. The Wall Street Journal quoted Greenspan as saying that investors “have extraordinarily low risk premiums now. Risk is no longer perceived as major risk, at least as it was in years past ....’12 If Greenspan is correct and if inflationary expectations are lower now than in 2002, then a decline in the rent-to-value ratio would result.
- Let’s then use 6 percent instead of 8 percent to represent the current environment. This change implies the market’s expectations of condo prices to be 3.3 percent per year.13 This is quite close to the rate of inflation of all goods and services, hence, we can say that real house prices are expected to be flat. As we pointed out in our last article, this is the most common outcome in U.S. housing markets following a period of sharply rising house prices.
- Scenario 3: We’re not there yet. You’ll note that we cut off Greenspan in mid-sentence. He went on to say that he finds the low-risk premiums “disturbing.” “We do not and cannot look into history without being very concerned when you see the absence of awareness and concern about risk that we see today.” If Greenspan is correct, then perhaps the current rent-to-value ratios are too low because investors are as “irrationally exuberant” about the future of house prices as they were about the stock market in the 2000.
- If this is the case, then, perhaps rent-to-value ratios will soon decline by, say, 0.5 percent. If this were to occur, then property values would have to fall by about 9 percent in order to restore equilibrium in Miami’s condo market.
So, have we hit bottom yet? The market for condos in Miami seems to be saying, yes. That is, it appears to say that we’re in the midst of a “soft landing” with positive appreciation on the horizon similar to what was experienced in 2005-06, but well down from 2002-2004. However, we think Greenspan may be on to something, so we think there is a good chance that we’re not there yet.
- See: http://www.anderson.ucla.edu/documents/areas/ctr/forecast/PE_ratio_update.pdf.
- “Did Changing Rents Explain Changing House Prices during the 1990s?” by Yan Chang, Amy Crews Cutts and Richard Green, 2005. http://www.gwu.edu/~business/research/workingpapers/Chang%20Cutts%20and%20Green%203-17-2005%201%20.pdf
- “A Trend and Variance Decomposition of the Rent -Value Ratio in Housing Markets,” by Sean Campbell, Martin Davis, Joshua Gallin and Robert Martin, April 2006. http://www.federalreserve.gov/pubs/feds/2006/200629/200629pap.pdf
- For those stock investors reading this, the FRB study also includes references to studies that cast dispersion on the predictive power of P/E ratios as well.
- A recent article on CNN.com offers an additional explanation: that is, the condo market is probably going to be the first to feel the effects of declining interest by investors (versus those buying to live in the house). http://money.cnn.com/2007/01/18/real_estate/condo_prices_reveal_trends/index.htm?postversion=20 07011813
- Absent the opportunity to obtain rent and value on the same property, you are left to using sophisticated statistical techniques of the type used by Chang et al and the FRB economists.
- The Miami condo market has been featured in many articles over the past years. Even 60 Minutes did a story about it: http://www.cbsnews.com/stories/2005/07/08/national/main707590.shtml
- We constructed this by comparing the sales prices of units sold in a particular year to its current market value, as estimated by the statistical models underlying Cyberhomes. We further restricted our attention to those condominiums in which the precision of the valuation is considered high. Our analysis is based upon the property valuations as of January 2007 and all sales from 2002 through 2006.
- Chang et al produced a rent-to-value ratio for the period prior to estimate for Miami closer to 4 percent. Given that we pegged our index values to this assumption, using 4 percent versus 5 percent would not affect the major conclusion of the aggregate approach.
- That is, 5.3 = 8 + 1 – 3.7. 1
- The Cleveland Fed keeps tabs on this and has a nice chart consistent with this point. See: http://www.clevelandfed.org/research/inflation/US-Inflation/index.cfm
- See the Wall Street Journal on Feb. 26, 2007: http://online.wsj.com/article/SB117248024161519153-search.html?KEYWORDS=greenspan%3B+risk+premiums&COLLECTION=wsjie/6month
- That is, 3.3 = 6 + 1 – 3.7.
News & Insights
-
Green Light for GSA’s OASIS SB Vehicle
-
GAO Ruling Validates FI Consulting’s Financial Analysis