A Mortgage Modeler Offers Subprime Crisis Hindsight
Trying to answer the question: How did so many financial analysts miss the mark?
![]() By James R. Follain, Ph.D., Cyberhomes Contributor
By James R. Follain, Ph.D., Cyberhomes Contributor
Published: May 27, 2008
Last summer, the chairman of the Federal Reserve Board, Ben Bernanke, estimated the losses due to the subprime mortgage crisis would be in the range of $50-100 billion. He was not alone in his thinking, and he had a great team of economists to support his thinking. More recent estimates, with the benefit of hindsight, suggest the ultimate price tag may be closer to $400 billion.
An obvious question is how so many outstanding financial analysts missed the mark so badly. An answer is important to any successful plan to clean up what is now officially labeled as the Subprime_mortgage_crisis by Wikipedia. My response reflects the experience of someone in the trenches of model building for many years and a desire to offer a humble and, perhaps, overly simplistic answer.
My sense is that the complex statistical models underlying these forecasts made two key mistakes. First, the modelers and their users overestimated the ability of models built prior to the boom in subprime lending to explain the behavior of subprime mortgages. Second, the models and their users seriously underestimated the potential of house prices to decline by substantial amounts without a precipitous decline in the national or local economy.
Mistake #1: Overestimating the applicability of prime loan models to subprime mortgages. Let’s begin with a look at what most mortgage modelers would have accepted at the beginning of the crisis as solid facts about mortgage performance:
- Mortgages with a higher loan-to-value ratio are more likely to default, all else equal. Hence, lenders charge higher rates on these loans. The empirical evidence on this point is based upon the analysis of many millions of mortgages for the past 30 years.
- Borrowers with lower credit scores are more likely to default, all else equal. Evidence on the role of the credit rating, called a FICO score, is also based upon the analysis of millions of loans. However, this evidence has been available only since the early 1990s when credit scores were becoming commonplace and, most importantly, addressed relatively traditional loans to borrowers in the upper portions of the credit score distribution, i.e. 620 and above.
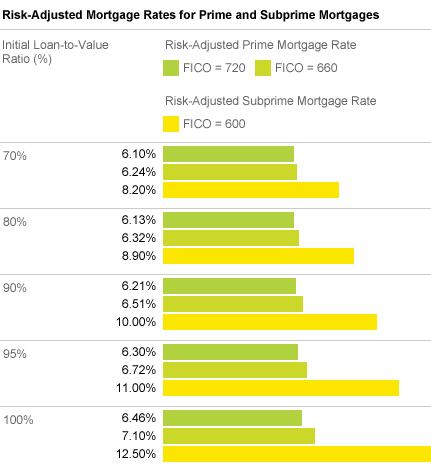
The results of a typical model of mortgage performance based upon these two factors are shown below. These are based upon a model I developed with Mike Sklarz, while we were working at Fidelity Hansen Quality, entitled “Pricing Market Specific Bubbles” and published in Mortgage Banking Magazine in October 2005. It shows what a risk-adjusted mortgage rate would be for several different initial loan-to-value ratios and two different FICO scores (720 and 660). For example, the mortgage rate on a loan with an initial loan-to-value ratio of 70 percent and a borrower FICO score of 720 is estimated to be 6.1 percent. The lender would have to charge 6.72 percent to a borrower with a 95 percent loan-to-value ratio and a 660 FICO score. The higher rate is because the second loan has a much higher risk of borrower default. The lender would expect to earn the same rate of return on both loans.
What we and other modelers were much less sure about were the impacts of the many other loan features being used to lure new subprime borrowers into home ownership, especially in the high-cost regions of the country. These new borrowers typically had FICO scores below 620 and into the 500s, which were much lower than the levels typically observed in the 1990s. Also, the new mortgages typically included 10 or more mortgage characteristics not typically found in prime mortgages. These included prepayment penalties; adjustable-rate mortgages tied to new indexes and with variable periods of fixed interest rates, teaser rates, option ARMs, and various degrees of less-than-complete documentation of borrower income and assets.
A great example of this point is the role of the borrower’s ability to pay for the mortgage, which is typically captured by the ratio of the mortgage payment to the borrower’s income at origination. Many of the new mortgages did not require complete documentation of borrower income and were adjustable-rate mortgages in which the borrower was given several payment options each month. The classic example of this is the Option ARM, which allows borrowers to make four different types of payments, one of which was the minimum payment akin to a credit card that would allow the amount of outstanding debt to grow, i.e. negative amortization. Though mortgages of this type had been around since the mid-1990s for high FICO borrowers with low payment-to-income ratios, we had little or no experience with the performance of these and other nontraditional mortgages to borrowers with much lower FICO scores, higher loan-to-value ratios, and little or no documentation of the borrower’s income.
I and others believed the appropriate risk-adjusted rates for these subprime loans would be higher than the traditional fixed-rate product to prime borrowers, but we didn’t have years of empirical data on which to base our estimates, especially to take account of the new mortgage characteristics noted above. Examples of the rates that emerged from our subprime model were based more upon judgments than were the rate estimates generated by the traditional prime model.
Some comparisons of the rate estimates for subprime mortgages show how they might vary with initial loan-to-value ratios. For example, a 100 percent loan-to-value ratio might require a rate of 12.5 percent to a subprime borrower versus 8.2 percent to a subprime borrower with a 70 percent loan-to-value ratio.
These may seem high; indeed, our estimates of the appropriate subprime mortgages rates were sometimes thought to be too high by some of our potential clients! Also, there were many models being used by analysts, especially in the latter days of the house price boom, which generated risk-adjusted rates much lower than our estimates. Unfortunately, neither we nor those favoring lower risk-adjusted rates were in a position to speak definitively on the issue. Neither side had enough data to be definitive. Also, what data we had were based upon mortgages issued during the house price boom, and we surely know now that house price appreciation during 2001 to 2006 hid many sins.
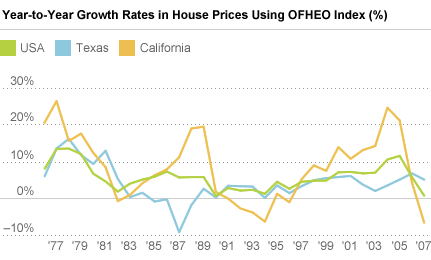
Mistake #2: Underestimating the potential of a severe house price decline without a recession. Sizable declines in house prices for large regions of the country are relatively rare events in the United States. Conventional wisdom prior to 2007 held that large regional price declines were associated with substantial declines in the national or regional economy. Two such episodes, the most severe regional housing price declines in the past 40 years, are seen in a price index generated by the Office of Federal Housing Enterprise Oversight. The first was Texas in the mid-1980s, which was triggered by the oil bust of the early 1980s and the S&L crisis. The other was California in the mid-1990s, triggered by the sharp recession of the early 1990s, problems with the Japanese economy and the closing of military bases in Southern California. House prices declined by about 13 percent over a three-year period in both instances. There were also many relatively isolated examples of boom and bust cycles in smaller areas of the country, but as discussed in a previous article, "Reading Clues About the Market Future," these typically led to subsequent periods of flat house price growth, not deep declines.
The most prominent critics of this conventional wisdom, in my view, are Robert Shiller and Karl Case, who have developed their own set of house price indexes and other studies to suggest that booms can be expected to lead to busts even when the fundamental economic factors show little signs of stress. The most recent Case-Shiller Price Index shows a 9.1 percent decline in house prices for its composite index for 20 large metropolitan areas.
Case and Shiller have for many years championed the idea that house price patterns are substantially affected by psychological factors and a herd mentality not always closely related to movements in the fundamental drivers of the economy. Most recently, Shiller provided a very nice summary of his view in a recent New York Times op-ed piece, “How a Bubble Stayed Under the Radar Screen,” Shiller argues that the combination of great uncertainty about the future of house prices and our tendency to follow what we see others doing during such times can and has led to the current boom-bust cycle for housing prices. As such, steep increases and decreases in house prices can happen without a serious decline in the economy.
Though I remained skeptical of their predictions, they were surely influencing my thinking about the proper way to price mortgage credit risk among markets in the midst of a boom cycle. Sklarz and I even titled our 2005 paper “Pricing Market Specific Bubbles” to highlight the potential connection between risk-adjusted mortgage rates and the likelihood of a bursting of a house price bubble. We tried to make the point that even if the likelihood of a large national or even regional price bubble was small absent a recession, there could be substantial price declines in some markets in which house price appreciation had been particularly strong. Our approach suggested that lenders should increase their mortgage rates in some of these markets relative to the rest of the country. At the top of our list of MSAs most at risk were many within California and Florida. For example, we recommended that mortgage rates should be adjusted upward by 50-75 basis points (0.5 to 0.75 percentage points) in places such as Santa Barbara, San Diego and Naples, Fla.
Despite our confidence in our own judgments and the warnings of Case and Shiller, we were unsuccessful in convincing the bulk of the people to whom we were trying to sell the model of this impending threat. The most common response went something like this: “We love your work, but history shows that substantial house price declines are associated with recessions. Since we see little evidence that a recession is on the horizon, we think your forecasts are too bearish and your estimates of credit risk in the coastal cities are excessive.” We never had enough evidence to successfully counter this argument. Many smart and good economists — including myself and many good friends and colleagues — simply couldn’t believe or state with any serious degree of confidence what was about to happen in 2007: substantial price declines in many parts of the country while both the national economy and many of these local economies continued to grow.
We all know better now that house prices can decline substantially without a serious recession. The experience of 2007 and the specific evidence provided by the Case-Shiller indexes on this point are overwhelming. They show double-digit declines in house prices in many of the 20 MSAs covered by their indexes, during a year in which national employment grew by 110,000 jobs and real GDP growth was 2.2 percent and at an annual rate of 4.2 percent as late as the third quarter.
What is perhaps the scariest part of the current story is a consideration of what happens if we do enter a recession. I considered this question with a longtime colleague, Seth Giertz, in a presentation at the 2008 American Real Estate and Urban Economics Association meetings held in January in my hometown, New Orleans. We suggested that a recession and a serious and sustained drop in employment in 2008 could trigger house price declines worse that the Texas experience of the mid-1980s, which until now has been the AAA standard of a serious regional house price collapse.
In my view, the jury is still out on the relative roles of house price declines versus the increased availability of subprime mortgages as causes of the current crisis. Many predicted that the payment shocks about to be triggered in 2008 on many of these mortgages would lead to a surge in foreclosures. Perhaps, but as Chairman Ben Bernanke said recently, the damage done by payment shock and rate resets is probably already being dwarfed by the usual suspect: negative equity. At this point, I agree with him. The performance of the bulk of the subprime mortgages during periods of modest or average house price growth and the potential of rate resets to trigger foreclosures remains a topic in need of much more study.
As a mortgage modeler, the current problems offer both lessons and opportunities. I’m hopeful that many economists are and will be hard at work analyzing the events of 2007 and through the end of this dismal cycle in house prices, whenever that may be. If so, perhaps we can again have models in which we have confidence, like the prime models of old. Until then, mortgage modelers like myself need to eat a little humble pie.
News & Insights
-
Green Light for GSA’s OASIS SB Vehicle
-
GAO Ruling Validates FI Consulting’s Financial Analysis